
There is nothing more American than our diet. The American diet is notorious for its high intake of fats, sugars, and carbohydrates—and rightfully so. The average American consumes 77 grams of sugar a day, over double the American Heart Association’s recommendation of 25 grams for women and 38 grams for men. The average American also gets over half of their calories from saturated fats and carbohydrates. This is reflected in America’s rising diabetes rate, with over 37 million Americans having diabetes, the equivalent of over 10 percent of the nation’s population.
The American diet is incredibly dangerous in more ways than we may realize. But it is no longer solely American. Globally, we are seeing a rise in the consumption of fats, sugars, and processed foods along with an increase in people with high blood pressure, cardiovascular disease, and diabetes. At the same time, we are witnessing an increase in global trade openness. These trends are not independent of each other. Just as we are what we eat, we eat what we trade. As globalization has continued to increase, so too has the influence of the American diet.
US companies such as Coca-Cola have contributed greatly to the popularization of the American diet, with over 1.9 billion servings of their drinks consumed in more than 200 countries per day. Fast food restaurants such as McDonald’s and KFC have brought the American diet right to other countries’ doorsteps.
Trade openness and free trade agreements have almost become a precursor to a country’s rising obesity rates.
Nowhere is this phenomenon more clear than in Mexico. Since the North American Free Trade Agreement (NAFTA) took effect in 1994, Mexico has experienced an extreme increase in its imports of processed and high fructose corn syrup products from the United States because the multilateral agreement played a considerable role in lowering tariffs on these goods. Consequently, as Alyshia Gálvez, a professor of Latin American, Latino, and Puerto Rican Studies at the City University of New York, explains, “Today in Mexico, basics like water, roads, and internet connectivity are not available in some rural communities. But Coca-Cola is everywhere.” That is no overstatement. Mexico is the world’s largest consumer of Coca-Cola, with the average person consuming 163 liters annually. Similarly, imports of high fructose corn syrup increased by 1,200 percent between 1996 and 2012.
The aftermath of these increases is most evident in the rise in Mexico’s obesity and diabetes rates. In 1984, a decade before NAFTA took effect, the share of adults overweight or obese in Mexico was 44.5 percent. In 2016, that number exploded to 64.9 percent. Obesity has become such a significant public health issue that, in 2019, diabetes and heart disease were the leading causes of death in Mexico.
After NAFTA, the United States received an increase in imports of fresh fruits and vegetables, but Mexico did not receive the same in return. But this is not to say that Mexico has not tried to remedy this unequal trade agreement. When Mexico tried to limit high fructose corn syrup imports by imposing a tax on them, the World Trade Organization (WTO) struck it down, siding with the argument made by the United States that the tariff conflicted with WTO rules.
In the United States-Mexico-Canada Agreement (USMCA), NAFTA’s replacement, this pattern continued with policies such as one in which the United States made it more difficult for Mexico to put warning labels on junk food.
Beyond NAFTA and the USMCA, there is an unignorable relationship between trade openness and obesity. In a study across 175 countries from 1975-2016, the trade openness index was found to be positively correlated with a country’s obesity prevalence. Specifically, a 10 percent increase in the openness index was associated with a 0.8 percent increase in a country’s obesity rate. An increase in free trade not only leads to greater calorie availability—especially from high-sugar and high-fat foods—but also changes dietary norms. Trade openness can enhance the image of Western culture and thereby glorify more Americanized foods.
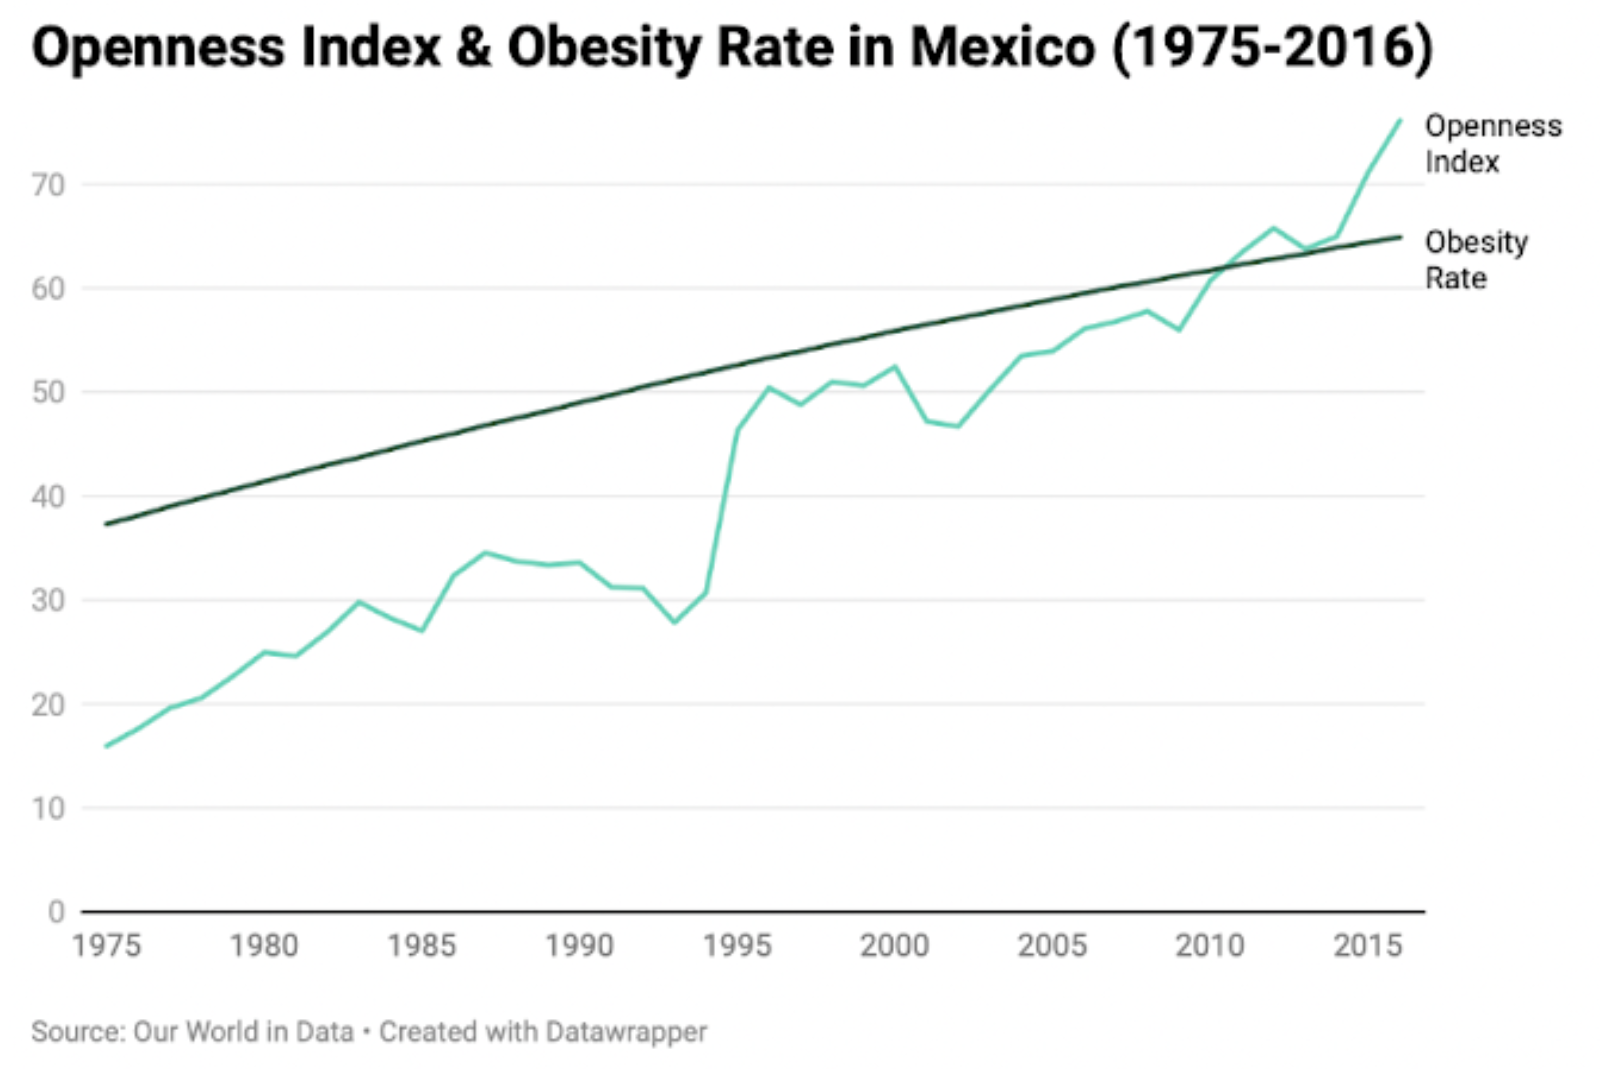
Although the openness index and obesity rate in Mexico from 1975 to 2016 are visually correlated, we can also corroborate the correlation using the Pearson correlation coefficient of the dataset. The Pearson correlation coefficient—which quantifies the extent to which two variables are correlated—of the dataset comparing the openness index and obesity rate of Mexico between 1975 to 2016 is approximately 0.965. This confirms that there is a strong positive correlation between the two variables.
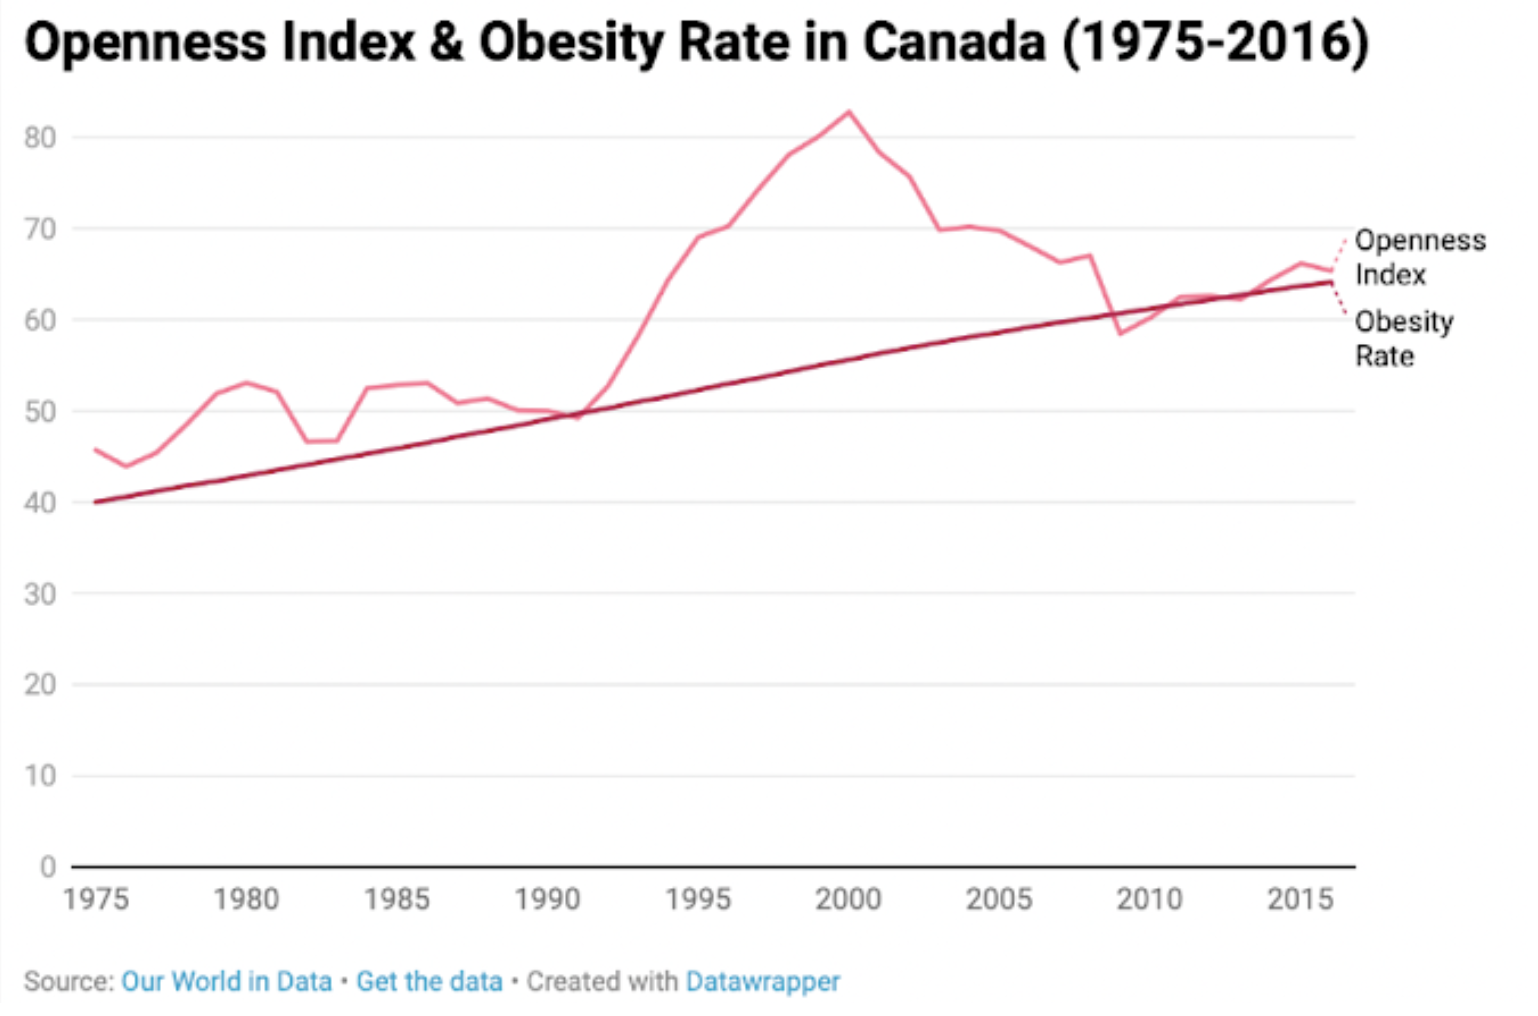
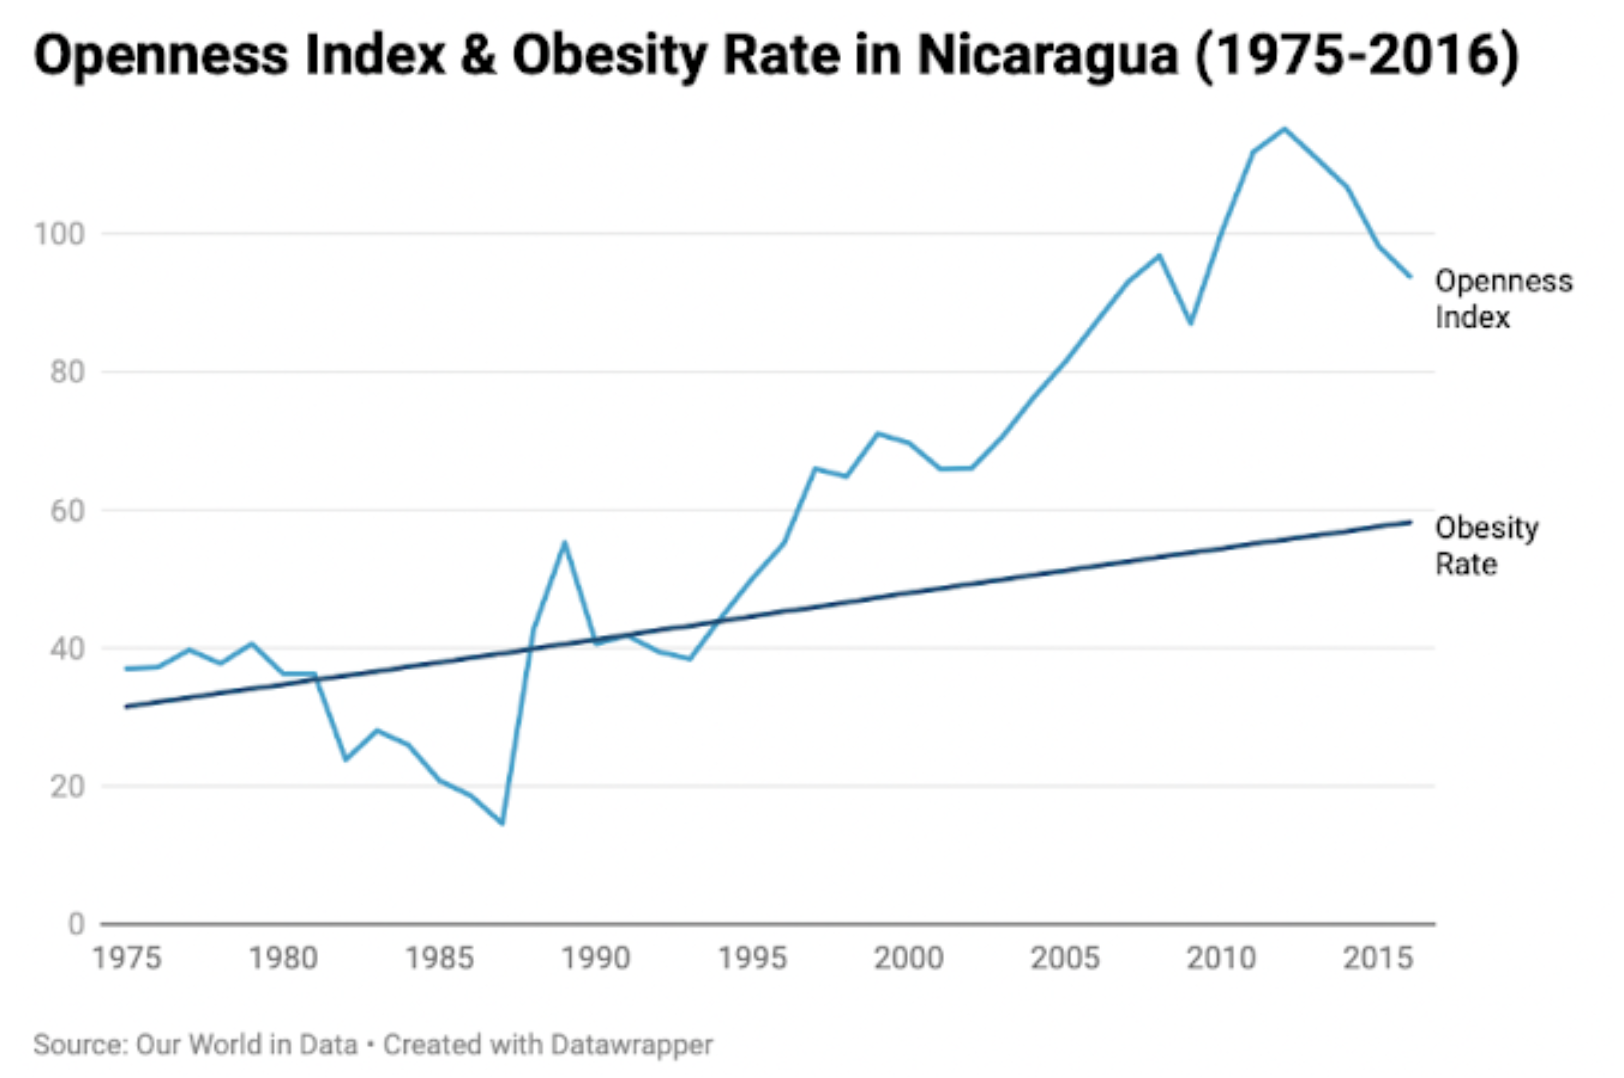
Analyzing the relationships between the openness index and obesity rates in Canada and Nicaragua yields similarly strong correlations. The Pearson correlation coefficient comparing the openness index and obesity rate of Canada from 1975 to 2016 is approximately 0.699, while that between the openness index and obesity rate in Nicaragua is approximately 0.912.
The relationship between obesity and free trade does not mean we should end all free trade agreements. Rather, we should treat these finds as opportunities to change the way we trade. Free trade agreements are not inherently unfair, but they naturally lead to unhealthier foods in our diets and therefore an increase in obesity rates.
The numbers cannot be ignored—free trade agreements are a public health issue. It is for this reason that we must view free trade from a public health perspective in addition to an economic one. We cannot continue to ignore the influence that free trade agreements have on a country’s obesity and diabetes rates and how our current system allows powerful countries to force public health crises on less powerful countries without an adequate system for objection. Ensuring that each member country has authority in the international arena and that traded goods are not on an unbalanced scale is crucial to preventing more powerful countries from taking advantage of less powerful ones. It is not about what we trade—it is about what we eat.
Statistical Note:
The Pearson correlation coefficient can be calculated using the following equation:
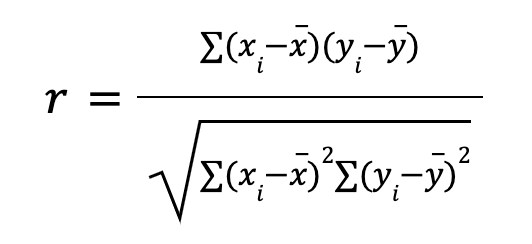
r = correlation coefficient
xi = values of the x-variable in the sample
x = mean of the values of the x-variable
yi = values of the y-variable in the sample
y = mean of the values of the y-variable
The Pearson correlation coefficient ranges from -1 to 1, with -1 indicating a total negative linear relationship and 1 indicating a total positive linear relationship.