In 2022, the federal government investigated the Massachusetts Bay Transportation Authority (MBTA), the agency in charge of both Boston’s metro system and its regional rail network. The results were damning. As a result of decades of neglect and deferred maintenance, the system has been plagued by speed restrictions, long wait times, and generally inconsistent service, culminating with the 2022 Orange Line fire. However, with the election of Maura Healey as governor of Massachusetts came her newly appointed general manager of the ‘T,’ Phillip Eng. Inheriting this disaster of a situation, he set to work reforming the MBTA, most notably launching the ambitious Track Improvement program. With its conclusion in December 2024, we can now look back and determine its impacts.
In May of 2023, the MBTA was crippled by 31.5 miles of speed restrictions covering 23.1 percent of Boston’s entire metro. Boston had a grand total of 214 slow zones, 97 of which were on the Red Line, 67 on the Green Line, 30 on the Orange Line, and 20 on the Blue Line. In March of 2025, however, following the ambitious Track Improvement Program, Boston’s Subway system sits presently at no speed restrictions.
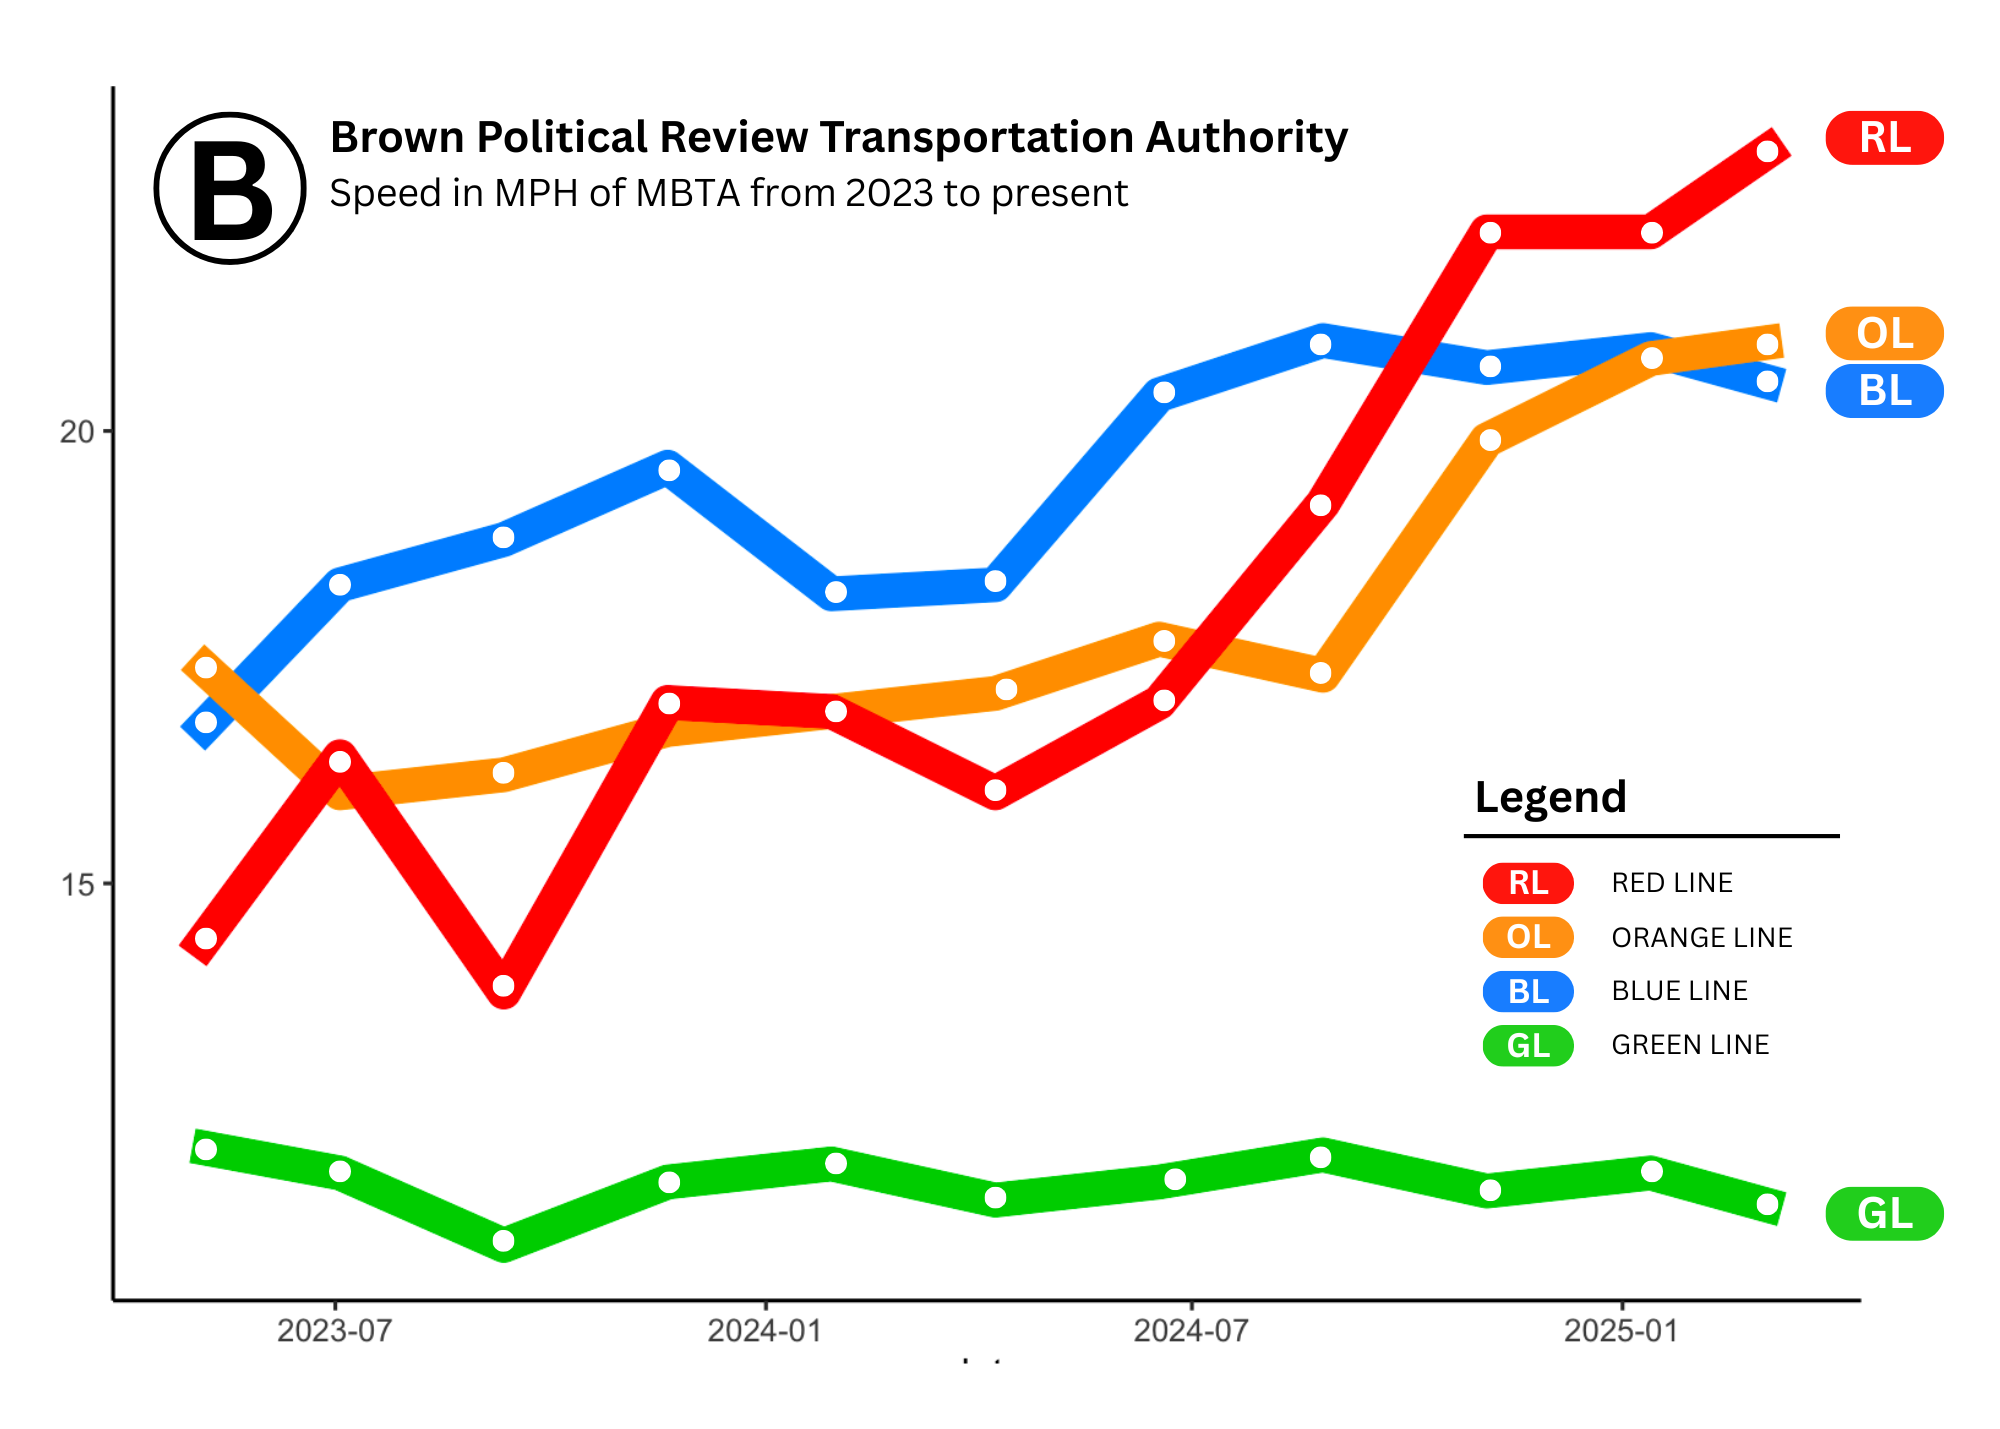
Zero speed restrictions throughout the system is impressive, but does the average MBTA rider feel a difference? Let’s look at the data.
Before the speed restrictions, the Red Line traveled at an average speed of 15.18 MPH, but since November, it has traveled at an average speed of 22.05 MPH, a statistically significant speed increase. The Orange line increased from an average of 16.69 MPH to 20.40 MPH, and in fact, during the week of March 10, 2025, exceeded its historical maximum speed set in 2020 (when every train was running faster due to low passenger counts). The Blue Line similarly had a statistically significant increase in speed, averaging 18.53 MPH before its shutdown and 20.50 MPH after.
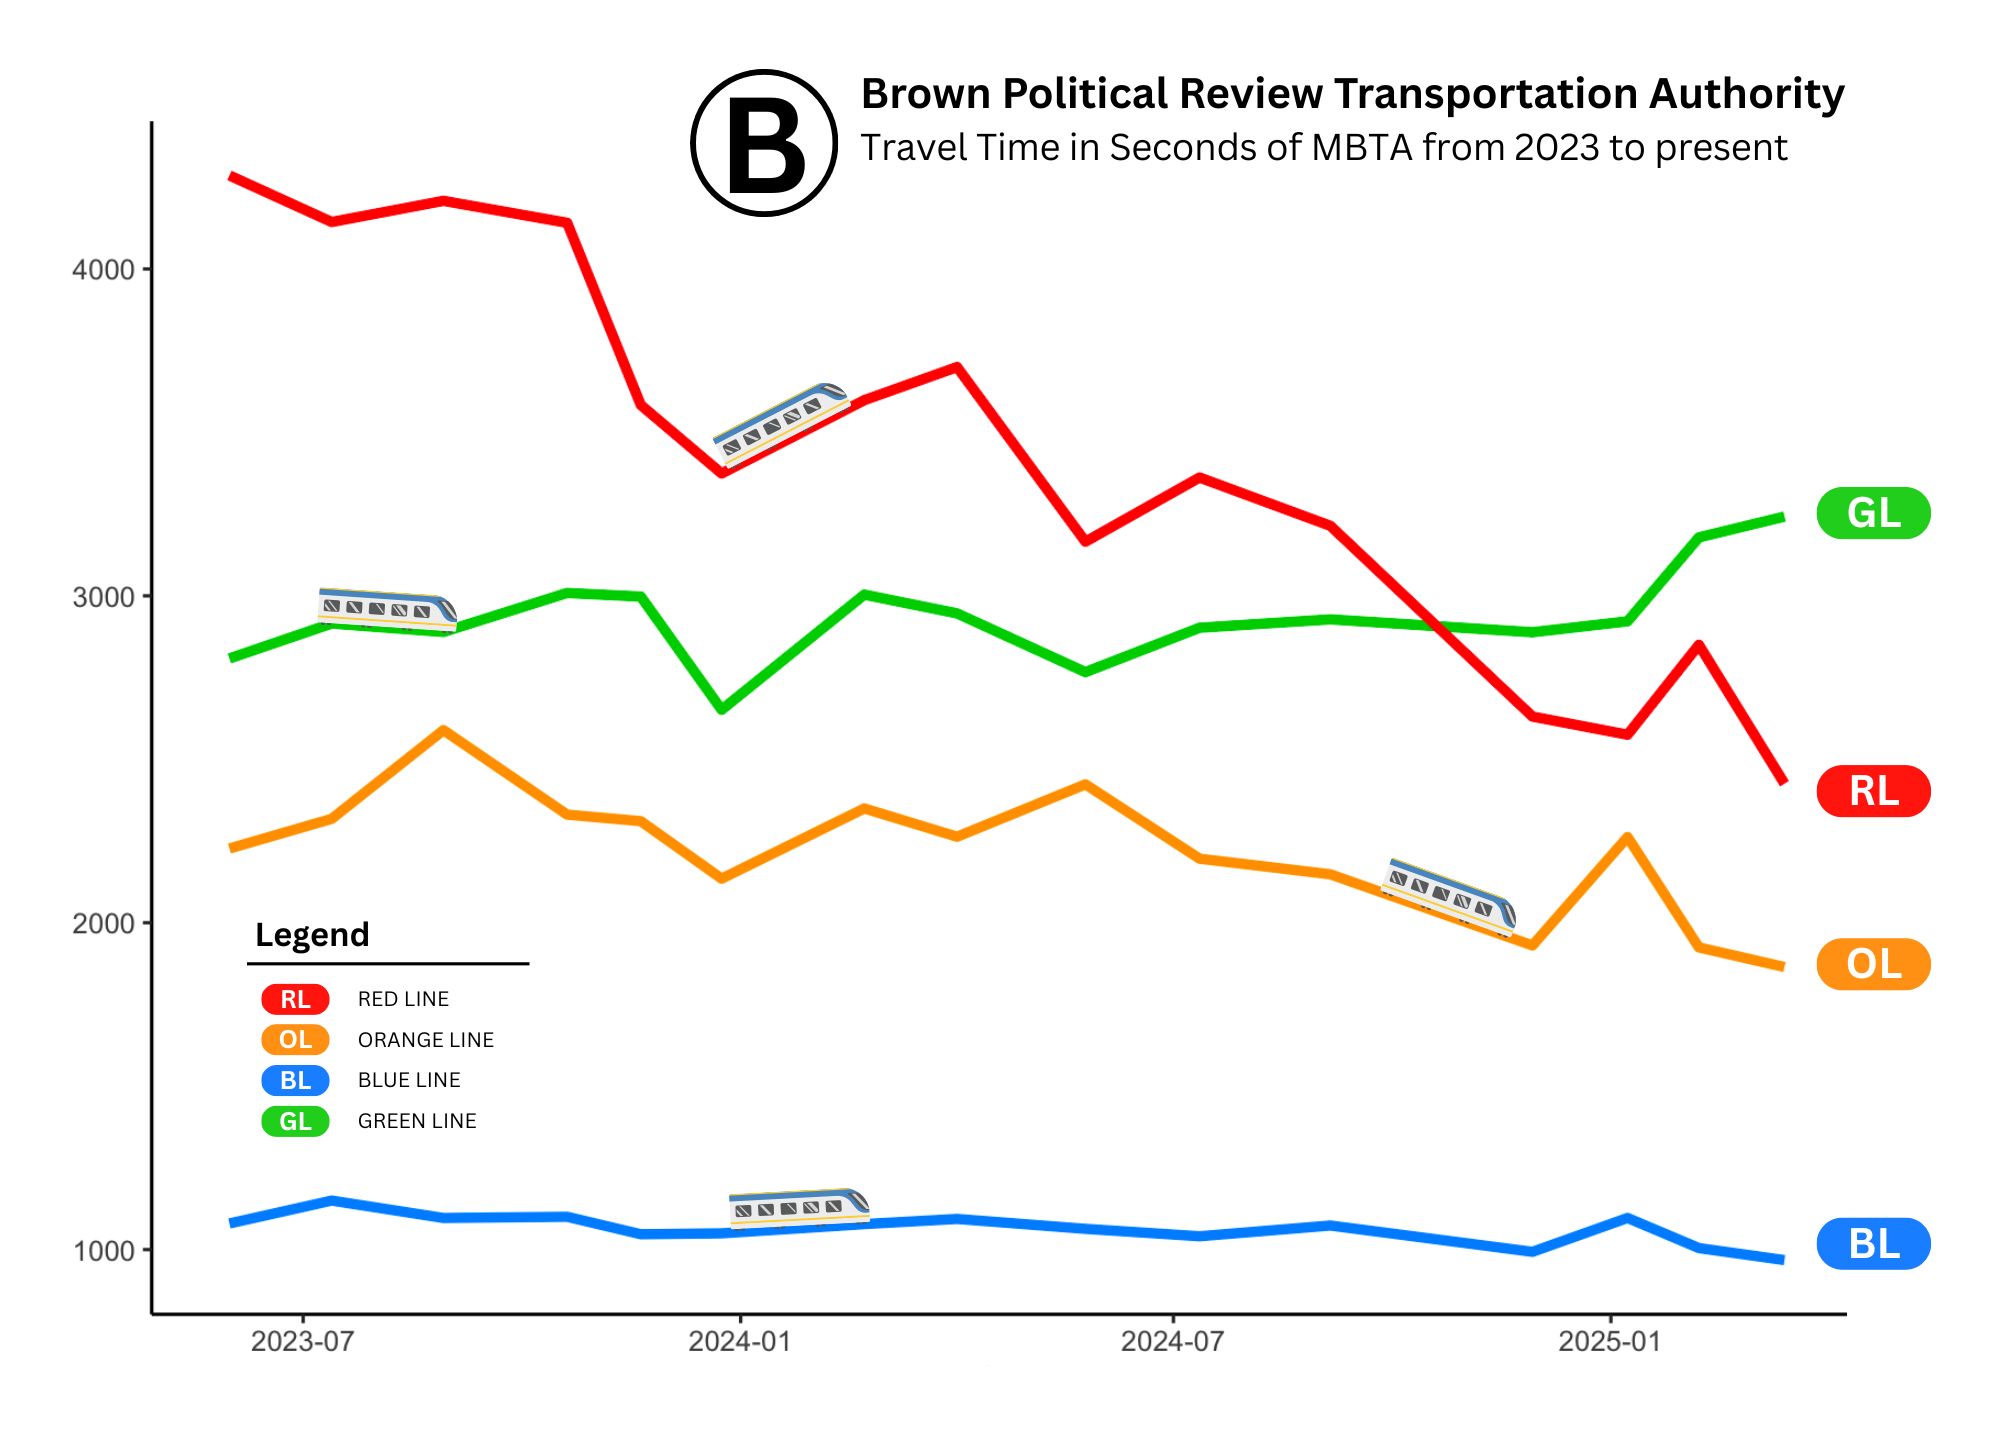
What about travel times? For all three heavy rail lines, there were statistically significant decreases in travel times. From penultimate station to penultimate station*, the southbound Red Line dropped its travel time from an average of 1:08 (and median of 1:07) to an average of 0:43 (and median of 0:42). In the northbound direction, the Red Line dropped from an average of 1:02 (and median of 1:01) to 0:45 (and median of 0:44). Meanwhile, the southbound Orange Line dropped from an average of 0:38 (median 0:39) to 0:31 (median 0:30), and the northbound Orange Line dropped from an average of 0:40 (median 0:39) to 0:33 (median 0:32).
The southbound Blue Line experienced a far smaller decrease in both average and median travel times after its track maintenance, from 18 to 17 minutes and 17 to 16 minutes respectively, but this is statistically significant with p << 0.001. In the northbound direction, the decrease was a bit more apparent (and even more statistically significant), from an average of 20 minutes to 17 and a median of 19 minutes to 16.
Unfortunately, the Green Line had a statistically significant decrease in average speed, declining from 11.98 MPH to 11.55 MPH (p = 0.00327), despite all of its slow zones being cleared. To understand why, we must consider the very structure of the Green Line itself.
As a semi-metro system and the legacy of Boston’s once-spanning streetcar network, the Green Line, which uses light rail rolling stock, consists of four branches, three street-running and one grade-separated (i.e. no crossings with roads), which eventually converge into one tunnel, known as the Central Subway, before splitting up again into the recently-built, grade-separated Green Line extension (GLX).
The issues that arise from such an eccentric line are manifold: on the three streetcar branches, the Green Line must obey road signals (for which it does not receive signal priority) and is limited to a top speed of 10 MPH. Once the four branches converge into the Central Subway, the line is prone to train bunching, in which the trains get stuck in traffic jams, waiting for long periods of time before they can enter a station. Finally, even for the grade-separated portions, the top speed of the Green Line is 25 MPH, much lower than the typical top speed of the heavy rail lines (which is 40 MPH). Thus, even if the tracks are in good maintenance, the rolling stock of the Green Line is simply not rated to go fast.
So what can be done about this? Unfortunately, the data does not reveal that substantial improvement is possible. The Green Line might appear to be fundamentally flawed in this regard. Most of what can be done has been done, from bringing the tracks into a state of good repair, modernizing the signal system, and, more recently, purchasing 100 new Type 10 LRVs from CAF.
As an aside, the MBTA operates another light rail line, the Mattapan Trolley, branded as part of the Red Line. The Mattapan Trolley runs 1940s-era PCC streetcars on a mostly grade-separated line, and although it did experience speed restrictions, travel times and speeds were not reduced, with the line averaging 6 minutes in either direction and 20 MPH both before and after the 2024 shutdowns. The MBTA is planning on upgrading the line to accommodate 24 Type 9 Green Line LRVs, introduced in 2018 to anticipate service increases after GLX.
What’s next for Boston’s recovering subway? Despite the success of the Track Improvement Program for the heavy rail lines, there is still work to be done. The Red and Orange Lines have antiquated analog signal systems, and scheduled shutdowns to convert them to more modern digital systems are underway. Currently, both are receiving new rolling stock produced by CRRC, with the Orange Line exclusively using new trainsets (with 16 cars left on order) and the Red Line having over 200 cars on order, which will replace the older, breakdown-prone rolling stock.
So what is the verdict? While the data tells us that the Track Improvement Program did succeed in course-correcting the T, there is undoubtedly more work to be done – and the MBTA knows it. Bostonians have suffered for years on the T and likely will continue to in the near future. But with competent leadership guiding the way, there is a light at the end of the tunnel. And it’s not the Orange Line on fire.
*We look at the penultimate stations rather than the start and end of the line due to how transitmatters.org presents the data. This is most likely for stability. If there is bunching, they can hold off on trains leaving on time to let the lines clear, but once a train starts, it generally keeps going.
Statistical Note:
Statistical significance is determined by checking the p-value of a given experiment. The p-value represents the probability that the observed data could occur assuming that the null hypothesis (i.e., there is no observed effect) is correct. A very small p-value denotes that the given data would be extremely unlikely to occur if the null hypothesis were true. In this particular example, we find that it is unlikely for these increased speeds and decreased travel times to occur without an underlying change, leading to the conclusion that the maintenance was successful in improving the T.